캐글 커널 필사하기
Introduction: Home Credit Default Risk Competition - Will Koehrsen
Introduction: Home Credit Default Risk Competition
보통 신용기록이 없는 사람들은 안정적인 금융권에서 대출을 받는데 어려움이 많아 고리 대출을 이용하게 된다. home credit에서는 다양한 데이터와 통계 및 머신러닝 기법으로 고객의 상환 능력을 예측하여 이러한 사람들에게도 긍정적인 대출 경험을 제공하려고 한다.
그래서 이 home credit은 고객의 대출 신청을 무조건 거절하는게 아니라 고객이 충분히 상환할 수 있는 적절한 원금, 만기 및 상환일정을 예측하는 등 데이터의 잠재력을 끌어낼 수 있길 바란다고 한다.
7가지 데이터 셋을 요약해보자.
- application_train/application_test: home credit의 각 대출금 신청 정보가 있다. 모든 대출에는 자체 행이 있고, SK_ID_CURR로 식별된다. 훈련 데이터는 대출이 상환되었거나(0), 상환되지 않은(1)이 제공된다.
- bureau: 다른 금융기관 고객의 이전 신용 데이터이다. 각 이전 신용은 자체적인 행이 있지만, 신청 데이터에서 대출금은 여러 개의 이전 credit을 가질 수 있다.
- bureau_balance: 위 부서의 월별 데이터이다. 각 행은 이전 한 달동안의 credit을 말하고, 이전 credit은 매월 한 행씩 여러 개를 가질 수 있다.
- previous_application: 신청 데이터에 대출이 있는 고객의 home credit에 대한 이전 대출금 신청이다. 각 신청 데이터에 있는 현재 대출금은 여러 개의 이전 대출금이 있을 수 있다. 각 이전 신청 기록은 한 행이며, SK_ID_PREV라는 특성에 의해 식별된다.
- POS_CASH_BALANCE: 고객이 home credit과 함께 가지고 있던 이전 판매지점 또는 현금 대출에 대한 월별 데이터이다. 각 행은 한 달간의 이전 판매지점 또는 현금 대출지점이며, 이전 대출금은 여러 행을 가질 수 있다.
- credit_card_balance: 고객이 home credit과 함께 사용한 이전 신용카드에 대한 월별 데이터이다. 각 행은 한 달간의 신용카드 잔액이며, 신용카드는 여러 행을 가질 수 있다.
- installments_payment: home credit의 이전 대출금 지불 기록이다. 지불할 때마다 한 행씩, 결제할 때마다 한 행씩 있다.
신용기록이 없는 사람들에게도 대출이 가능하도록 ‘이 사람이 상환능력이 되는가, 되지 않는가’의 예측 모델을 생성하는 것이 목표이다.
Home Credit 데이터를 이용한 데이터 분석 노트북 구성
1. Feature Engineering 메뉴얼 파트 1 (Manual Feature Engineering Part One)
2. Feature Engineering 메뉴얼 파트 2 (Manual Feature Engineering Part Two)
3. 자동화 Feature Engineering (Introduction to Automated Feature Engineering)
4. 향상된 자동화 Feature Engineering (Advanced Automated Feature Engineering)
5. Feature Selection
6. 모델 튜닝: 그리드 탐색과 랜덤 탐색 (Intro to Model Tuning: Grid and Random Search)
7. 자동화된 모델 튜닝 방법 (Automated Model Tuning)
8. 모델 튜닝 결과 (Model Tuning Results)
Feature Engineering 메뉴얼 파트 1 (Manual Feature Engineering Part One)
```{.python .cb.run} import numpy as np import pandas as pd from sklearn.preprocessing import LabelEncoder import os import warnings warnings.filterwarnings(‘ignore’) import matplotlib.pyplot as plt import seaborn as sns
훈련용 파일 1개, 테스트용 파일 1개, 예제 제출 파일 1개, 대출금에 대한 추가 정보가 포함된 기타 파일 6개로 총 9개 파일이 있다.

```python
app_train = pd.read_csv('./input/home-credit-default-risk/application_train.csv')
print('Training data shape: {}'.format(app_train.shape))
app_train.head()
app_test = pd.read_csv('./input/home-credit-default-risk/application_test.csv')
print('Testing data shape: {}'.format(app_test.shape))
app_test.head()
EDA
타겟 데이터는 우리가 예측하는 것으로, 0이면 대출금을 갚을 능력이 있다는 것이고, 1이면 대출금을 갚기가 어려운 것을 나타낸다. 우리는 각 카테고리에 속하는 대출금들의 수를 조사할 수 있다.
app_train['TARGET'].value_counts()
app_train['TARGET'].astype(int).plot.hist()
위의 그래프를 통해 제때 갚지 못한 대출금보다 제때 갚은 대출금이 훨씬 많은 불균형 문제를 살펴볼 수 있다. 좀 더 정교한 머신러닝 모델을 만들게 된다면, 이러한 데이터의 불균형을 반영할 수 있다.
결측치 조사
# 열마다의 결측치 계산을 위한 함수
def missing_values_table(df):

    mis_val = df.isnull().sum()
    mis_val_percent = 100 * df.isnull().sum() / len(df)
    mis_val_table = pd.concat([mis_val, mis_val_percent], axis=1)

    mis_val_table_ren_columns = mis_val_table.rename(columns={0: 'Missing Values', 1: '% of Total Values'})

    mis_val_table_ren_columns = mis_val_table_ren_columns[mis_val_table_ren_columns.iloc[:, 1] != 0].sort_values('% of Total Values', ascending=False).round(1)

    print("Your selected dataframe has " + str(df.shape[1]) + " columns.\n"
          "There are " + str(mis_val_table_ren_columns.shape[0]) +
          " columns that have missing values.")

    return mis_val_table_ren_columns
missing_values = missing_values_table(app_train)
missing_values.head(20)
Column Types
각 column의 데이터 타입을 살펴보자. int64와 float64는 수치형 특성이고, object는 문자열을 포함하고 범주형 특성이다.
app_train.dtypes.value_counts()
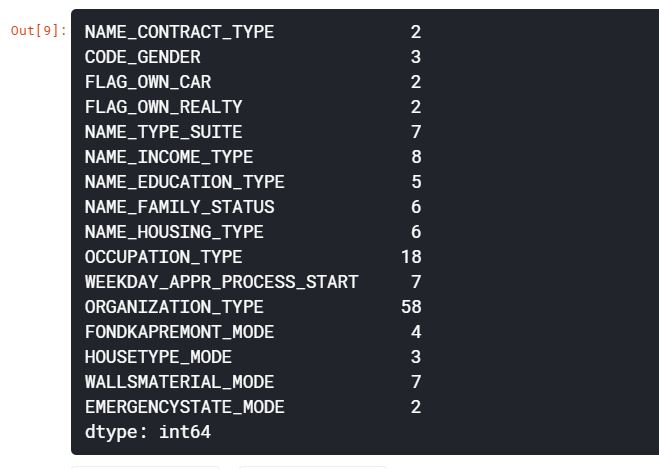
app_train.select_dtypes('object').apply(pd.Series.nunique, axis=0)
범주형 특성 인코딩
머신러닝 모델은 LightGBM과 같은 일부 모델을 제외하고는 범주형 변수를 다룰 수 없다. 따라서 이러한 변수를 수치형으로 인코딩한 뒤 모델에 적용해야 한다. 인코딩 방법은 2가지가 있다.
- Label Encoding: 범주형 변수의 각 고유 범주를 정수로 할당하기 때문에 새로운 열이 필요없다.
- One-hot encoding: 범주형 변수의 각 고유 범주에 대해 새로운 열을 생성한다. 각 관측치는 해당 범주에 대해서는 1을, 다른 범주에 대해서는 0으로 채워진다.
Label Encoding의 문제점은 각 범주를 임의의 순서로 할당된다는 것이다. 그렇기 때문에 Male/Female과 같은 2개의 고유 범주에만 Label Encoding을 사용하는 것이 좋고, 그 이상의 범주에는 One-hot Encoding이 안전하다.
One-hot Encoding의 유일한 단점은 특성의 수가 많은 데이터에 적용하면 너무나 많은 범주형 변수로 폭발한다는 것이다. 이를 해결하기 위해서 PCA나 다른 차원 축소 기법을 적용할 수 있다.
이 노트북에서는 2개의 카테고리만 있는 범주형 변수에 대해 Label Encoding을 적용하고, 2개 이상의 카테고리가 있는 범주형 변수에 대해서는 One-hot Encoding을 적용할 것이다.
Label Encoding은 Scikit-Learn의 Label Encoder를 사용하고, One-hot Encoding은 pandas의 get_dummies 함수를 사용한다.
le = LabelEncoder()
le_count = 0

for col in app_train:
    if app_train[col].dtype == 'object':
        # 2개 이하의 카테고리만 있는 경우
        if len(list(app_train[col].unique())) <= 2:
            le.fit(app_train[col])
            app_train[col] = le.transform(app_train[col])
            app_test[col] = le.transform(app_test[col])
            le_count += 1

print('{} columns were label encoded.'.format(le_count))
app_train = pd.get_dummies(app_train)
app_test = pd.get_dummies(app_test)

print('Training Features shape: {}'.format(app_train.shape))
print('Testing Features shape: {}'.format(app_test.shape))
Training과 Testing Data 정렬
훈련셋과 테스트셋에는 같은 특징이 있다. 테스트셋에는 표현되지 않은 카테고리 변수들로 인해 훈련셋을 원-핫 인코딩을 사용하면 더 많은 열이 생성된다. 따라서 테스트셋에는 없는 훈련셋의 변수들을 제거하기 위해 데이터프레임을 정렬해야 한다.
train_labels = app_train['TARGET']

app_train, app_test = app_train.align(app_test, join='inner', axis=1)
app_train['TARGET'] = train_labels

print('Training Features shape: {}'.format(app_train.shape))
print('Testing Features shape: {}'.format(app_test.shape))
Anomalies(이상치)
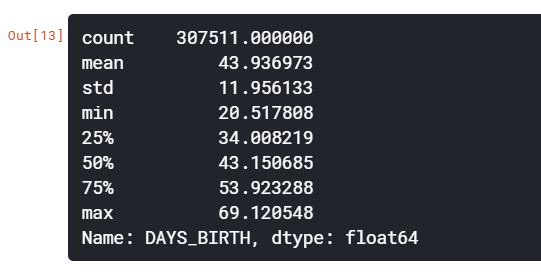
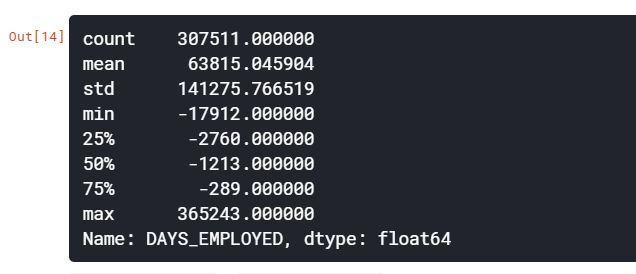
이상치를 통계적인 수치로 확인할 수 있는 방법은 데이터프레임의 describe함수이다.
(app_train['DAYS_BIRTH'] / -365).describe()
app_train['DAYS_EMPLOYED'].describe()
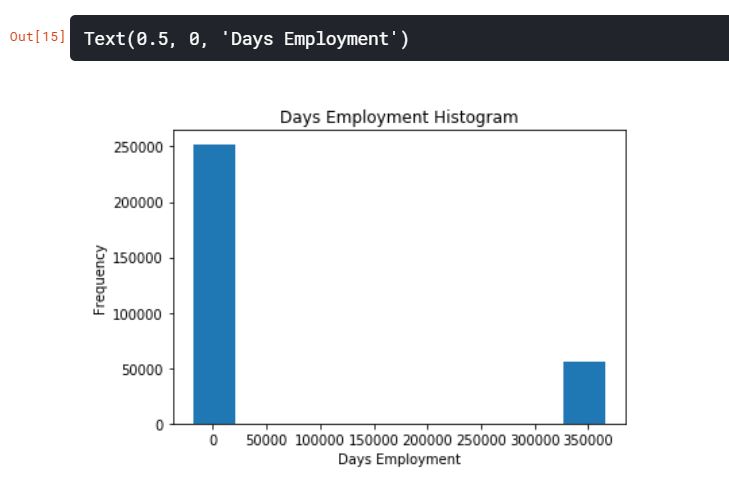
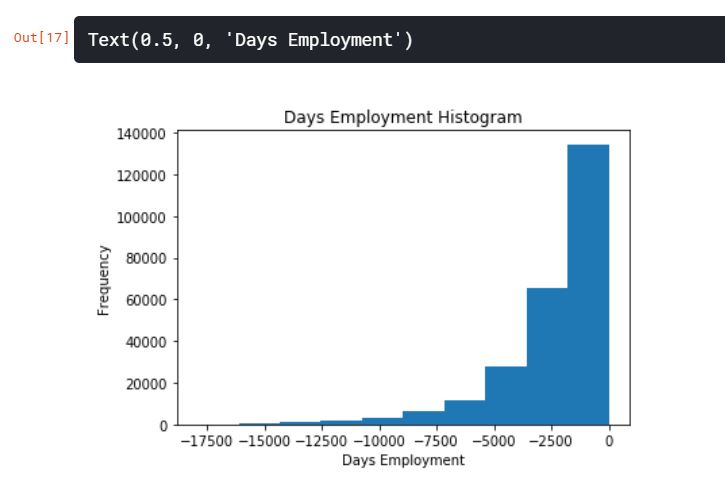
DAYS_BIRTH 특성은 아무 문제가 없어보이지만, DAYS_EMPLOYED의 최대값이 약 1,000년이라는 것은 문제가 있어보인다.
app_train['DAYS_EMPLOYED'].plot.hist(title='Days Employment Histogram')
plt.xlabel('Days Employment')
변칙적인 고객들의 집합을 만들어서 그들이 나머지 고객들보다 더 높거나 낮은 채무 불이행률을 가지는 경향이 있는지 확인해보자.
anom = app_train[app_train['DAYS_EMPLOYED'] == 365243]
non_anom = app_train[app_train['DAYS_EMPLOYED'] != 365243]

print('The non-anomalies default on {:.2f}% of loans'.format(100 * non_anom['TARGET'].mean()))
print('The anomalies default on {:.2f}% of loans'.format(100 * anom['TARGET'].mean()))
print('There are {} anomalous days of employment'.format(len(anom)))
이상치가 디폴트값보다 낮은 것으로 보인다.
이상치를 다루는 것은 정해진 규칙이 없이 상황에 따라 달라진다. 가장 안전한 방법 중 하나는 이상치를 누락으로 설정하여 머신러닝에 적용하기 전에 Imputation을 사용하는 것이다. 이 경우, 모든 이상치들이 같은 값을 지니기 때문에, 공통으로 공유하고 있는 대출금을 대비하여 같은 가치를 가질 수 있도록 채워넣을 수 있다. 이상치들은 어느정도 중요성을 가지기 때문에, 머신러닝 모델을 말하기 위해선 실제로 이러한 값들을 채워야 한다. 따라서, 이상치를 숫자가 아닌 Nan으로 채운 다음, 그 값이 변칙적이었는지를 나타내는 boolean열을 새로 만드는 것이다.
이상치 플래그 컬럼 생성
app_train['DAYS_EMPLOYED_ANOM'] = app_train['DAYS_EMPLOYED'] == 365243
nan 값을 이상치로 대체
app_train['DAYS_EMPLOYED'].replace({365243: np.nan}, inplace=True)

app_train['DAYS_EMPLOYED'].plot.hist(title='Days Employment Histogram')
plt.xlabel('Days Employment')
분포를 보면 우리가 예상한 것보다 훨씬 일치한다. 또한, 우리는 이러한 값이 원래 이상치였다는 것을 모델에 말하기 위해 새로운 열을 만들어준 것이다.
마찬가지로 테스트셋에서도 새로운 열을 만들고, 이상치들을 Nan값으로 채워준다.
app_test['DAYS_EMPLOYED_ANOM'] = app_test['DAYS_EMPLOYED'] == 365243
app_test['DAYS_EMPLOYED'].replace({365243: np.nan}, inplace=True)

print('There are {} anomalies in the test data out of {} entries'.format(app_test['DAYS_EMPLOYED_ANOM'].sum(), len(app_test)))
상관관계
상관계수는 특성의 ‘관련성’을 나타내는 가장 좋은 방법은 아니지만, 데이터 내에서 가능한 관계에 대한 아이디어를 제공해준다.
correlations = app_train.corr()['TARGET'].sort_values()

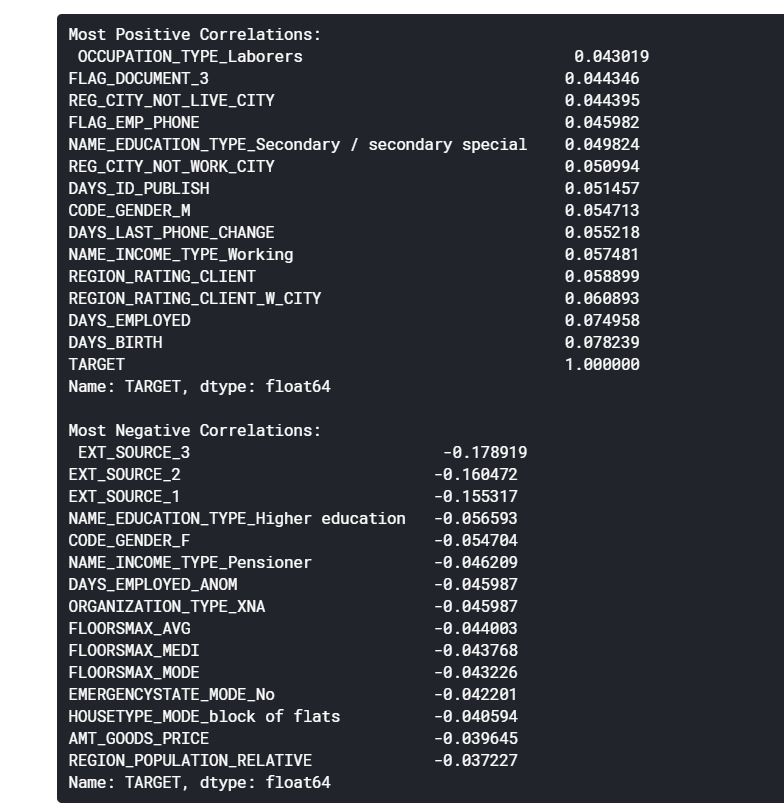
print('Most Positive Correlations:\n {}'.format(correlations.tail(15)))
print('\nMost Negative Correlations:\n {}'.format(correlations.head(15)))
위의 상관관계를 보면 DAYS_BIRTH가 가장 긍정 상관관계에 있다는 것을 확인할 수 있다. DAYS_BIRTH는 대출 당시 고객의 나이이다. 상관관계에서는 양수지만, 이 특징의 가치는 사실 음수로, 클라이언트의 나이가 들수록 대출금의 채무불이행 발생률이 낮아진다는 것을 의미한다. 이러한 결과는 혼동을 불러일으킬 수 있기 때문에 절댓값을 취하는 것이 좋다.
app_train['DAYS_BIRTH'] = abs(app_train['DAYS_BIRTH'])
app_train['DAYS_BIRTH'].corr(app_train['TARGET'])
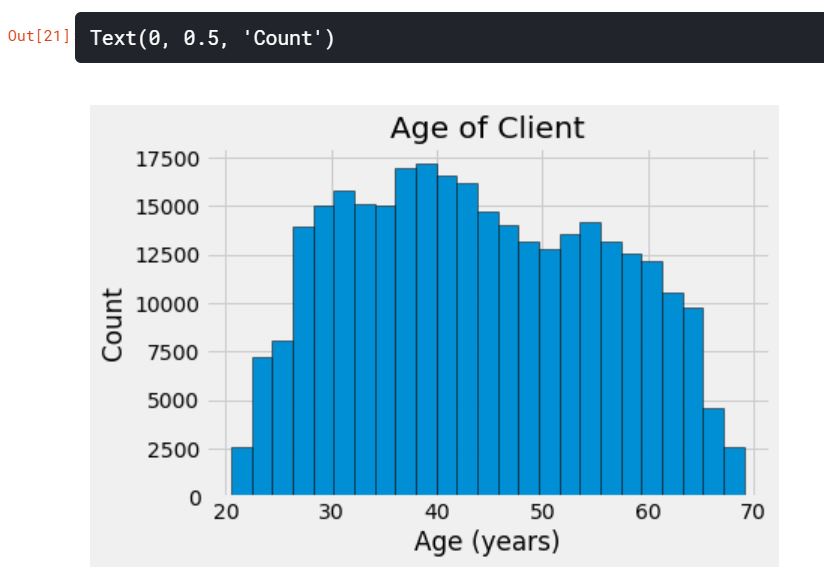
이로써, 클라이언트의 나이가 들수록 그들의 대출금을 제때 갚으려는 경향이 있다.
plt.style.use('fivethirtyeight')
plt.hist(app_train['DAYS_BIRTH'] / 365, edgecolor='k', bins=25)
plt.title('Age of Client')
plt.xlabel('Age (years)')
plt.ylabel('Count')
KDE(Kernel Density Estimation)
plt.figure(figsize=(10, 8))

sns.kdeplot(app_train.loc[app_train['TARGET'] == 0, 'DAYS_BIRTH'] / 365, label='target ==0')
sns.kdeplot(app_train.loc[app_train['TARGET'] == 1, 'DAYS_BIRTH'] / 365, label='target == 1')

plt.xlabel('Age (years)')
plt.ylabel('Density')
plt.title('Distribution of Ages')
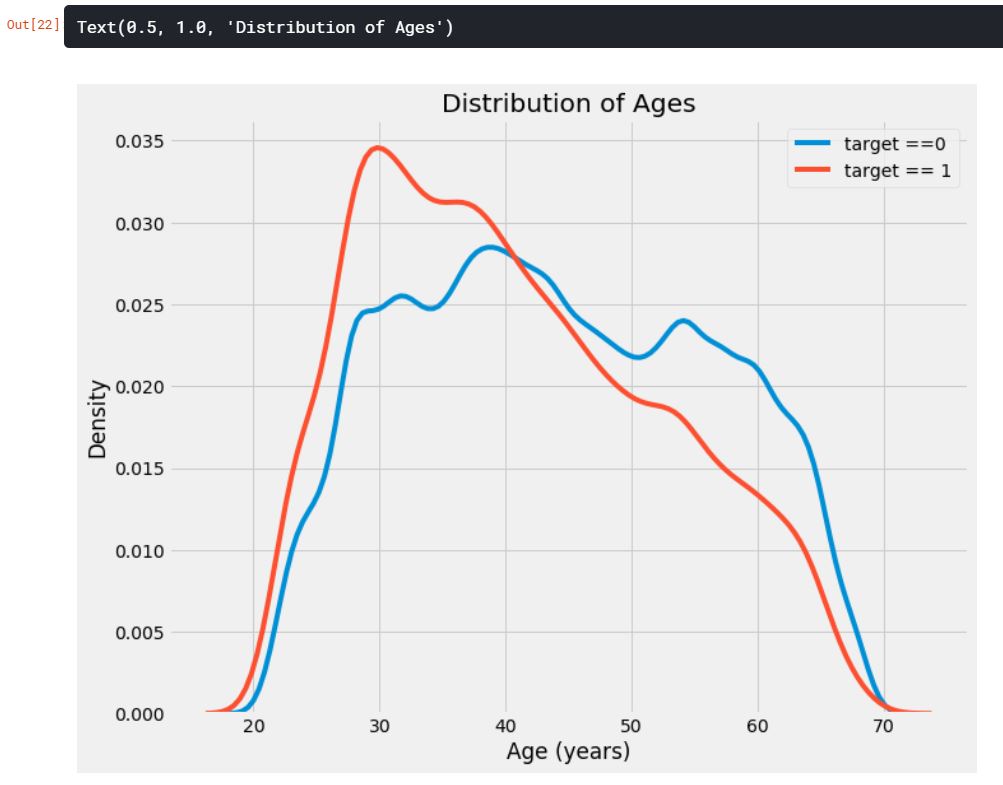
target == 1의 곡선이 젊은 쪽으로 기울어지는 것을 확인할 수 있다. 이것은 유의미한 상관관계가 아니지만, 머신러닝 모델에서 타겟에 영향을 줄 수 있기 때문에 사용할 수 있다. 평균 연령대별 대출상환 불이행을 통해 관계를 살펴보자.
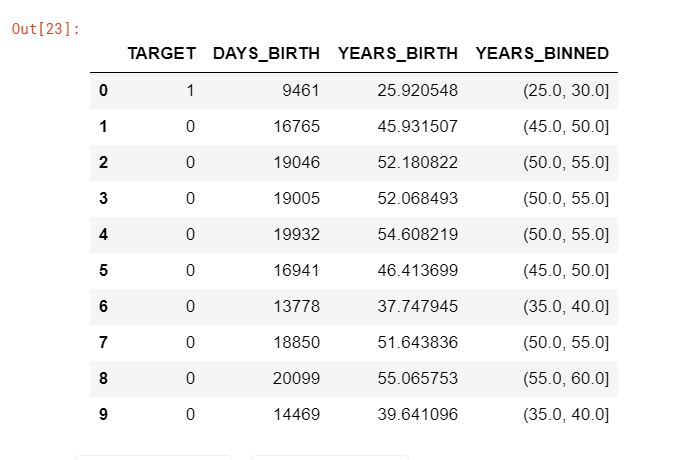
age_data = app_train[['TARGET', 'DAYS_BIRTH']]
age_data['YEARS_BIRTH'] = age_data['DAYS_BIRTH'] / 365
age_data['YEARS_BINNED'] = pd.cut(age_data['YEARS_BIRTH'], bins=np.linspace(20, 70, num=11))
age_data.head(10)
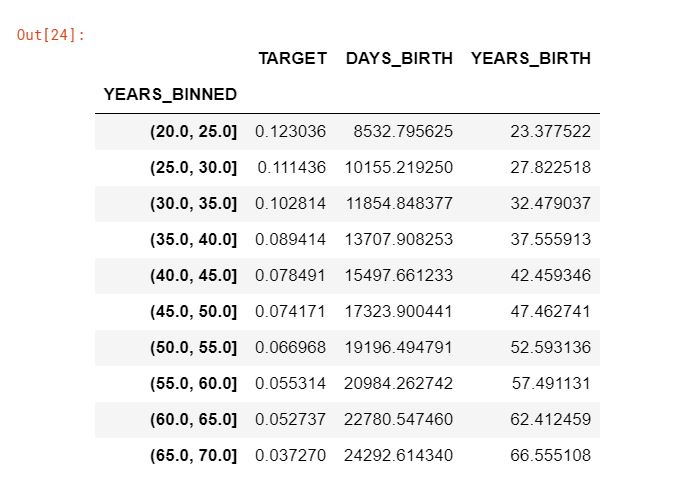
age_groups = age_data.groupby('YEARS_BINNED').mean()
age_groups
plt.figure(figsize=(8, 8))
plt.bar(age_groups.index.astype(str), 100*age_groups['TARGET'])
plt.xticks(rotation=75)
plt.xlabel('Age Group (years)')
plt.ylabel('Failure to Repay (%)')
plt.title('Failure to Repay by Age Group')
위의 그래프를 통해 확실히 젊은 연령대가 대출 상환금을 제때 갚지 못하는 것을 알 수 있다. 이러한 정보는 은행들에게 직접적으로 도움이 될 수 있다. 은행은 아마도 젊은 고객들에게 대출금을 갚기가 어려움을 알기 때문에, 그들에게 재정적인 계획 팁을 알려주거나 가이드를 제시할 필요가 있다. 또한, 이러한 정보를 통해 젊은 고객층을 배제하는 것이 아니라 그들이 제때 갚을 수 있도록 예방책을 마련하는 것이 중요하다.
<br
Exterior Sources
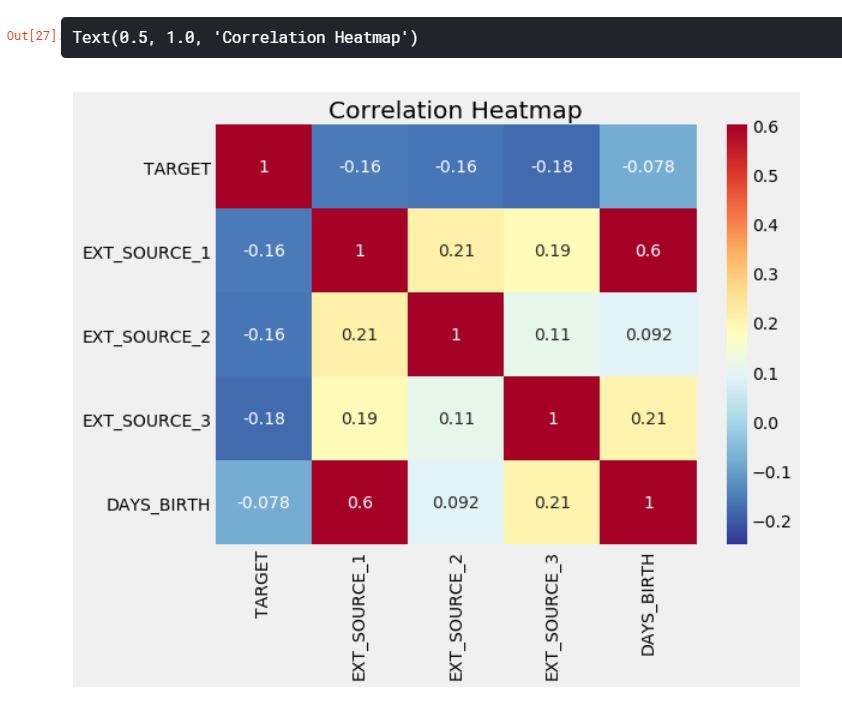
3개의 변수 EXT_SOURCE_1, EXT_SOURCE_2, EXT_SOURCE_3는 타겟 데이터와 음의 상관관계를 보여주고 있다. 문서에 따르면, 이 특성들은 “외부 데이터 소스로부터 정규화된 값들”을 표현하고 있다.
# EXT_SOURCE 변수에서 상관관계 추출하기
ext_data = app_train[['TARGET', 'EXT_SOURCE_1', 'EXT_SOURCE_2', 'EXT_SOURCE_3', 'DAYS_BIRTH']]
ext_data_corrs = ext_data.corr()
ext_data_corrs
plt.figure(figsize=(8, 6))
sns.heatmap(ext_data_corrs, cmap=plt.cm.RdYlBu_r, vmin=-0.25, annot=True, vmax=0.6)
plt.title('Correlation Heatmap')
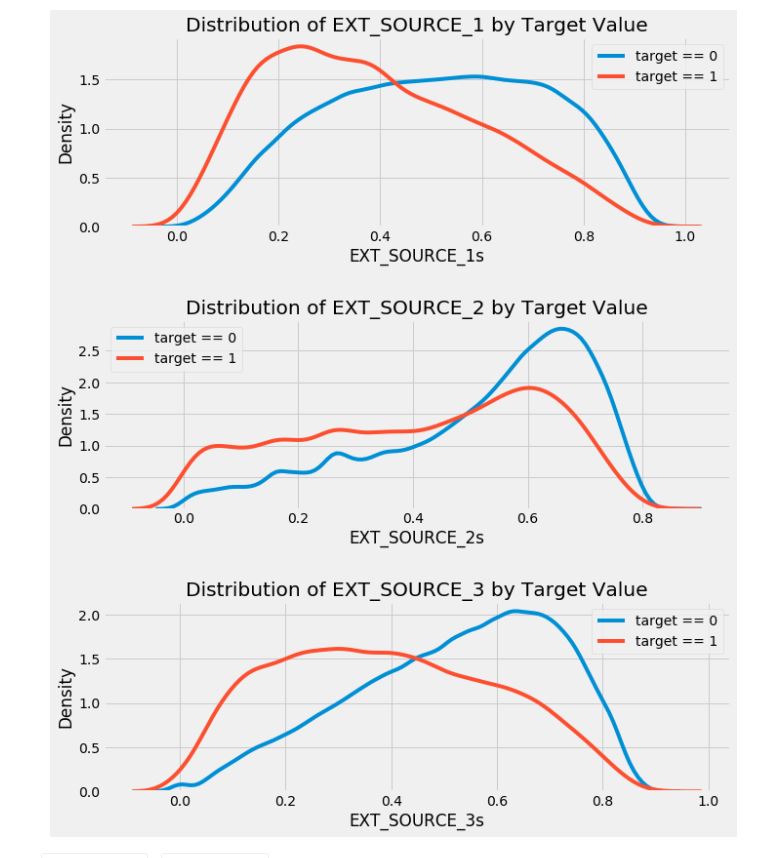
plt.figure(figsize=(10, 12))
for i, source in enumerate(['EXT_SOURCE_1', 'EXT_SOURCE_2', 'EXT_SOURCE_3']):

    plt.subplot(3, 1, i+1)
    sns.kdeplot(app_train.loc[app_train['TARGET'] == 0, source], label='target == 0')
    sns.kdeplot(app_train.loc[app_train['TARGET'] == 1, source], label='target == 1')

    plt.title('Distribution of %s by Target Value' % source)
    plt.xlabel('%ss' %source)
    plt.ylabel('Density')

    plt.tight_layout(h_pad=2.5)
EXT_SOURCE_3가 타겟 데이터에 대해 가장 큰 차이가 나타난다. 우리는 이 특징이 대출 상환 신청자와 어느정도 관계가 있는 가능성이 있다고 볼 수 있다. 하지만 그 관계는 그다지 강한 편은 아니지만, 이러한 변수들이 이후에 머신러닝 학습 모델에 있어서 지원자가 제때에 대출금을 상환할지 여부를 예측하는 데 유용할 것이다.
Pairs Plot
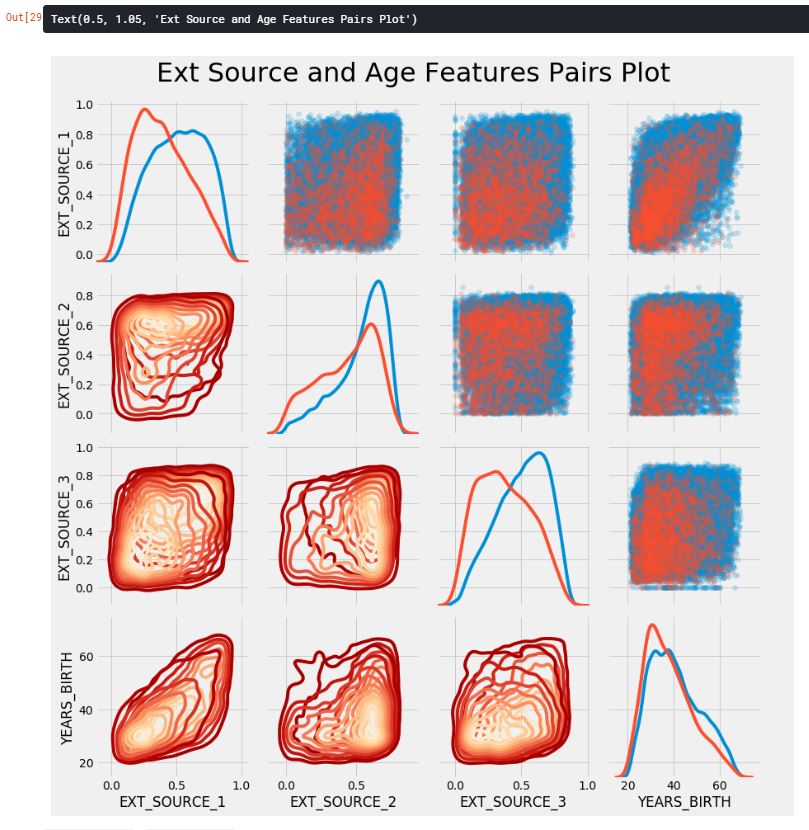
pair plot으로 EXT_SOURCE와 DAYS_BIRTH 변수의 관계를 확인해보자.
plot_data = ext_data.drop(columns=['DAYS_BIRTH']).copy()
plot_data['YEARS_BIRTH'] = age_data['YEARS_BIRTH']
plot_data = plot_data.dropna().loc[:100000, :]

def corr_func(x, y, **kwargs):
    r = np.corrcoef(x, y)[0][1]
    ax = plt.gca()
    ax.annotate("r = {:.2f}".format(r), xy=(.2, .8), xycoords=ax.transAxes, size=20)

# Create the parigrid object
grid = sns.PairGrid(data=plot_data, size=3, diag_sharey=False, hue='TARGET', vars=[x for x in list(plot_data.columns) if x != 'TARGET'])

grid.map_upper(plt.scatter, alpha=0.2)
grid.map_diag(sns.kdeplot)
grid.map_lower(sns.kdeplot, cmap=plt.cm.OrRd_r)

plt.suptitle('Ext Source and Age Features Pairs Plot', size=32, y=1.05)
위의 그래프에서, 빨간색 선은 갚은 대출금, 파란색 선은 갚지 않은 대출금을 나타낸다. EXT_SOURCE_1과 DAYS_BIRTH 사이에는 중간 정도의 양의 선형관계가 있는 것으로 보인다. 이러한 특징들은 고객의 연령을 생각하는 것을 알 수 있다.
Feature Engineering
특성공학은 캐글에서 우승을 하기 위해 반드시 해야할 것으로, 더 좋은 모델을 만들기 위해서 필요하다. 최근에는 모델링과 하이퍼파라미터 튜닝 작업보다 특성공학을 중요시하는 추세이다.
우리는 2가지 간단한 특성 공법을 시도할 것이다.
- Polynomial Features
- Domain Knowledge Features
Polynomial Features
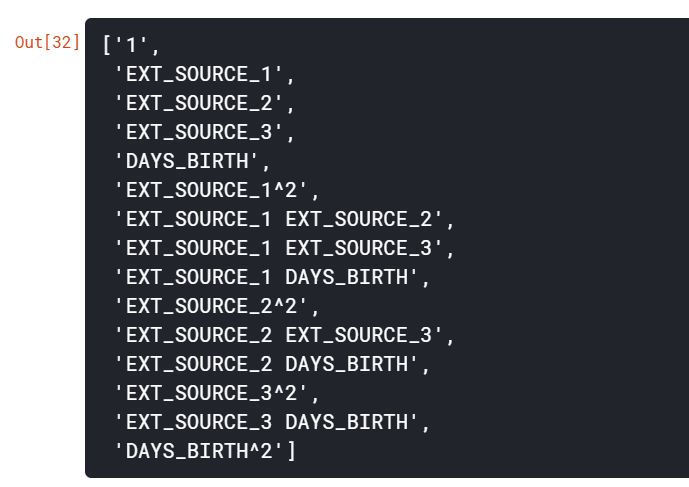
polynomial features는 기존에 존재하고 있는 특성들간의 상호작용 특성을 만드는 것이다. 예를 들어, EXT_SOURCE_1^2와 EXT_SOURCE_2^2 그리고 EXT_SOURCE_1 x EXT_SOURCE_2, EXT_SOURCE_1 x EXT_SOURCE_2^2, EXT_SOURCE_1^2 x EXT_SOURCE_2^2와 같은 변수를 만들 수 있다.
이러한 특성들은 상호작용 변수라는 다중 개별 변수들의 집합이다. 다른 말로 타겟에 강한 영향을 주지 않는 두 변수들이지만, 이들을 하나의 상호작용 변수로 결합하면 대상과의 관계를 나타낼 수 있다.
우리는 EXT_SOURCE 변수와 DAYS_BIRTH 변수를 사용하여 polynomial features를 만들 것이다.
poly_features = app_train[['EXT_SOURCE_1', 'EXT_SOURCE_2', 'EXT_SOURCE_3', 'DAYS_BIRTH', 'TARGET']]
poly_features_test = app_test[['EXT_SOURCE_1', 'EXT_SOURCE_2', 'EXT_SOURCE_3', 'DAYS_BIRTH']]

from sklearn.impute import SimpleImputer

imputer = SimpleImputer(strategy='median')

poly_target = poly_features['TARGET']
poly_features = poly_features.drop(columns=['TARGET'])

# 결측치 채우기
poly_features = imputer.fit_transform(poly_features)
poly_features_test = imputer.transform(poly_features_test)

from sklearn.preprocessing import PolynomialFeatures

poly_transformer = PolynomialFeatures(degree=3)
poly_transformer.fit(poly_features)
poly_features = poly_transformer.transform(poly_features)
poly_features_test = poly_transformer.transform(poly_features_test)

print('Polynomial Features shape: {}'.format(poly_features.shape))
poly_transformer.get_feature_names(input_features=['EXT_SOURCE_1', 'EXT_SOURCE_2', 'EXT_SOURCE_3', 'DAYS_BIRTH'])[:15]
# 위의 특성들을 가지고 데이터프레임 생성하기
poly_features = pd.DataFrame(poly_features, columns=poly_transformer.get_feature_names(['EXT_SOURCE_1', 'EXT_SOURCE_2', 'EXT_SOURCE_3', 'DAYS_BIRTH']))
poly_features['TARGET'] = poly_target

poly_corrs = poly_features.corr()['TARGET'].sort_values()

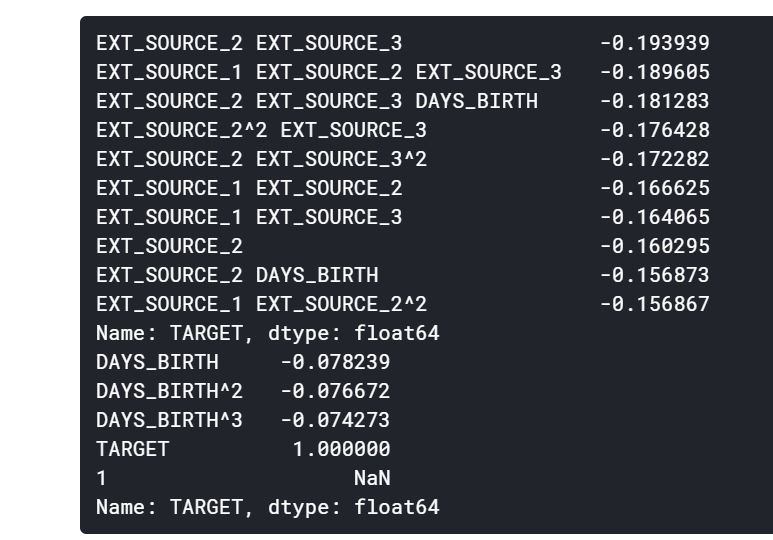
print(poly_corrs.head(10))
print(poly_corrs.tail(5))
몇몇의 새로운 변수들이 기존의 특성들보다 타겟과의 더 높은 관계를 보여주고 있다. 우리는 머신러닝 모델을 만들 때, 이 특성들이 과연 도움이 될지 확인해봐야 한다.
우리는 이 특성들을 훈련셋과 테스트셋의 복사본에 추가하고, 이 특성들이 포함하고, 안하고의 모델을 각각 평가한다.
poly_features_test = pd.DataFrame(poly_features_test,
                                  columns = poly_transformer.get_feature_names(['EXT_SOURCE_1', 'EXT_SOURCE_2',
                                                                                'EXT_SOURCE_3', 'DAYS_BIRTH']))
poly_features['SK_ID_CURR'] = app_train['SK_ID_CURR']
app_train_poly = app_train.merge(poly_features, on = 'SK_ID_CURR', how = 'left')

poly_features_test['SK_ID_CURR'] = app_test['SK_ID_CURR']
app_test_poly = app_test.merge(poly_features_test, on = 'SK_ID_CURR', how = 'left')

app_train_poly, app_test_poly = app_train_poly.align(app_test_poly, join='inner', axis=1)

print('Training data with polynomial features shape: {}'.format(app_train_poly.shape))
print('Testing data with polynomial features shape: {}'.format(app_test_poly.shape))
Domain Knowledge Features
우리는 고객이 대출을 하려고 할 때, 채무불이행 여부를 알리기 위한 중요한 몇 가지 기능을 만들 수 있다.
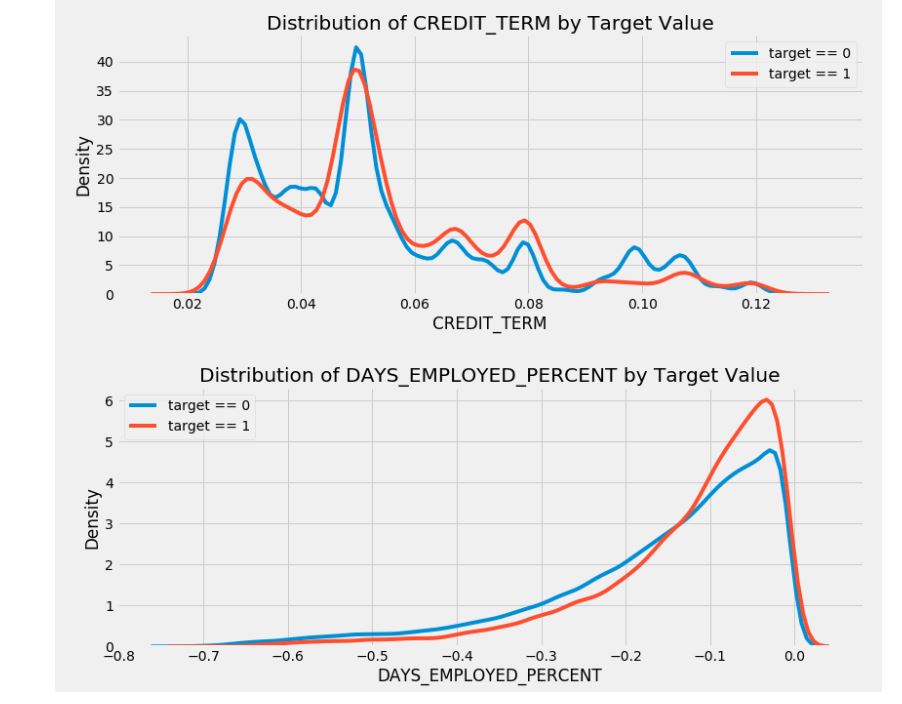
CREDIT_INCOME_PERCENT: 고객의 소득 대비 신용금액의 비율ANNUITY_INCOME_PERCENT: 고객의 소득 대비 대출금의 비율CREDIT_TERM: 월간 지불기간DAYS_EMPLOYED_PERCENT: 고객의 연령 대비 고용일의 비율
app_train_domain = app_train.copy()
app_test_domain = app_test.copy()

app_train_domain['CREDIT_INCOME_PERCENT'] = app_train_domain['AMT_CREDIT'] / app_train_domain['AMT_INCOME_TOTAL']
app_train_domain['ANNUITY_INCOME_PERCENT'] = app_train_domain['AMT_ANNUITY'] / app_train_domain['AMT_INCOME_TOTAL']
app_train_domain['CREDIT_TERM'] = app_train_domain['AMT_ANNUITY'] / app_train_domain['AMT_CREDIT']
app_train_domain['DAYS_EMPLOYED_PERCENT'] = app_train_domain['DAYS_EMPLOYED'] / app_train_domain['DAYS_BIRTH']
app_test_domain['CREDIT_INCOME_PERCENT'] = app_test_domain['AMT_CREDIT'] / app_test_domain['AMT_INCOME_TOTAL']
app_test_domain['ANNUITY_INCOME_PERCENT'] = app_test_domain['AMT_ANNUITY'] / app_test_domain['AMT_INCOME_TOTAL']
app_test_domain['CREDIT_TERM'] = app_test_domain['AMT_ANNUITY'] / app_test_domain['AMT_CREDIT']
app_test_domain['DAYS_EMPLOYED_PERCENT'] = app_test_domain['DAYS_EMPLOYED'] / app_test_domain['DAYS_BIRTH']
Visualize New Variables
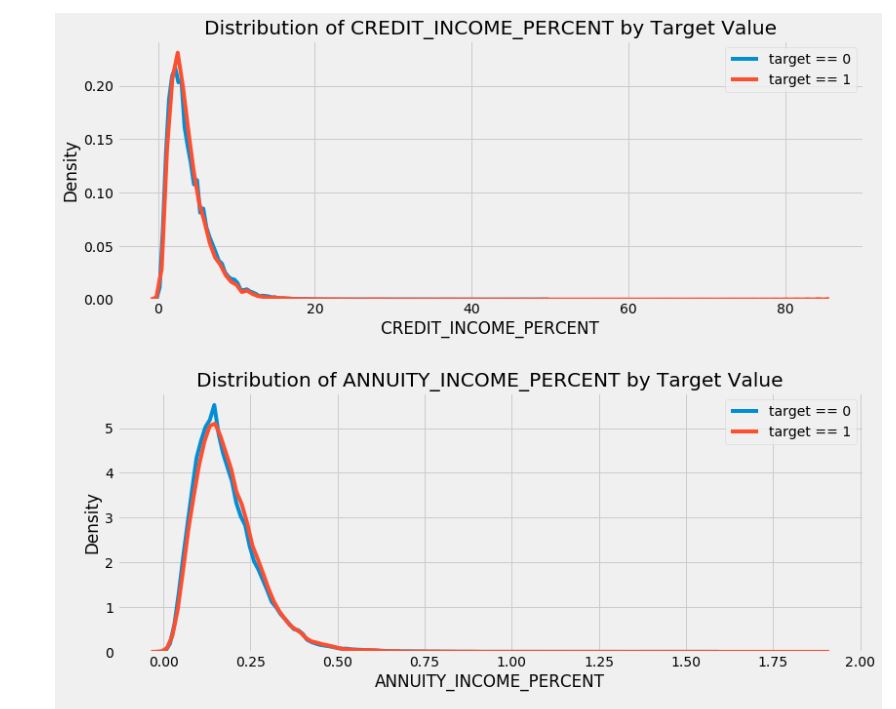
plt.figure(figsize=(12, 20))

for i, feature in enumerate(['CREDIT_INCOME_PERCENT', 'ANNUITY_INCOME_PERCENT', 'CREDIT_TERM', 'DAYS_EMPLOYED_PERCENT']):

    plt.subplot(4, 1, i+1)
    sns.kdeplot(app_train_domain.loc[app_train_domain['TARGET'] == 0, feature], label='target == 0')
    sns.kdeplot(app_train_domain.loc[app_train_domain['TARGET'] == 1, feature], label='target == 1')

    plt.title('Distribution of %s by Target Value' % feature)
    plt.xlabel('%s' % feature)
    plt.ylabel('Density')
    plt.tight_layout(h_pad=2.5)
새로운 특성들이 유용할지는 모르겠지만, 시험을 해보면서 살펴봐야 할 것 같다.
Logistic Regression Implementation
baseline 코드를 작성하기 위해서, 범주형 특성들을 인코딩하고 나서 모든 특성들을 사용할 것이다. 우리는 결측치를 imputation하여 채울 것이고, 특성들의 범위를 feature scaling을 통해 정규화를 시킬 것이다.
from sklearn.preprocessing import MinMaxScaler
from sklearn.impute import SimpleImputer

if 'TARGET' in app_train:
    train = app_train.drop(columns=['TARGET'])
else:
    train = app_train.copy()

features = list(train.columns)
test = app_test.copy()

imputer = SimpleImputer(strategy='median')
scaler = MinMaxScaler(feature_range=(0, 1))

imputer.fit(train)
train = imputer.transform(train)
test = imputer.transform(app_test)

scaler.fit(train)
train = scaler.transform(train)
test = scaler.transform(test)

print('Training data shape: {}'.format(train.shape))
print('Testing data shape: {}'.format(test.shape))
from sklearn.linear_model import LogisticRegression

log_reg = LogisticRegression(C=0.0001, multi_class='ovr', solver='liblinear')
log_reg.fit(train, train_labels)
모델을 훈련시켰으니, 우리는 이제 예측을 할 수 있다. 우리는 대출금을 지불하지 않을 확률을 예측하기를 원하기 때문에 predict.proba를 사용한다. 이것은 m x 2 배열을 반환하고, 여기서 m은 관측치이다. 첫 번째 열은 0일 확률이고, 두 번째 열은 1일 확률이다. 우리는 대출금이 상환되지 않을 확률을 원하기 때문에 두 번째 열을 선택한다.
log_reg_pred = log_reg.predict_proba(test)[:, 1]
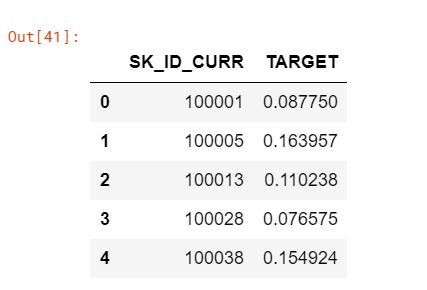
sample_submission.csv파일과 같은 형식으로 맞추기 위해서 SK_ID_CURR과 TARGET열로 이루어진 데이터프레임을 만든다.
submit = app_test[['SK_ID_CURR']]
submit['TARGET'] = log_reg_pred

submit.head()
submit.to_csv('log_reg_baseline.csv', index=False)
이 예측값은 대출금이 상환되지 않을 확률을 0에서 1사이로 나타낸다. 만약 우리가 이러한 예측을 신청자들을 분류하기 위해 사용한다면, 우리는 대출이 위험하다는 것을 결정하기 위한 확률의 임계값을 설정할 수 있을 것이다.
제출하였을 때, 로지스틱 회귀를 사용한 모델의 점수는 0.671이다.
Improved Model: Random Forest
from sklearn.ensemble import RandomForestClassifier

random_forest = RandomForestClassifier(n_estimators=100, random_state=50, verbose=1, n_jobs=-1)
random_forest.fit(train, train_labels)

feature_importance_values = random_forest.feature_importances_
feature_importances = pd.DataFrame({'feature': features, 'importance': feature_importance_values})

predictions = random_forest.predict_proba(test)[:, 1]
submit = app_test[['SK_ID_CURR']]
submit['TARGET'] = predictions

submit.to_csv('random_forest_baseline.csv', index=False)
제출하였을 때, 랜덤포레스트를 사용한 모델의 점수는 0.678이다.
Make Predictions using Engineered Features
polynomial features와 domain knowledge가 모델을 개선했는지 여부를 확인하는 유일한 방법은 이러한 특성에 대한 모델을 훈련시키는 것이다. 그 다음, 이러한 특성이 없는 모델에 대한 성능과 비교하여 특성공학의 효과를 측정할 수 있다.
poly_features_names = list(app_train_poly.columns)

imputer = SimpleImputer(strategy='median')
poly_features = imputer.fit_transform(app_train_poly)
poly_features_test = imputer.transform(app_test_poly)

scaler = MinMaxScaler(feature_range=(0, 1))
poly_features = scaler.fit_transform(poly_features)
poly_features_test = scaler.transform(poly_features_test)

random_forest_poly = RandomForestClassifier(n_estimators=100, random_state=50, verbose=1, n_jobs=-1)
random_forest_poly.fit(poly_features, train_labels)

predictions = random_forest_poly.predict_proba(poly_features_test)[:, 1]
submit = app_test[['SK_ID_CURR']]
submit['TARGET'] = predictions

submit.to_csv('random_forest_baseline_engineered.csv', index=False)
이 모델의 점수는 0.678로 특성공학을 하지 않은 모델과 정확히 같다. 이러한 결과는 이 데이터셋에서는 우리가 만든 특성이 결과에 영향을 주지 않는다는 것으로 알 수 있다.
Make Predictions using Domain Features
app_train_domain = app_train_domain.drop(columns='TARGET')
domain_features_names = list(app_train_domain.columns)

imputer = SimpleImputer(strategy='median')
domain_features = imputer.fit_transform(app_train_domain)
domain_features_test = imputer.transform(app_test_domain)

scaler = MinMaxScaler(feature_range=(0, 1))
domain_features = scaler.fit_transform(domain_features)
domain_features_test = scaler.transform(domain_features_test)

random_forest_domain = RandomForestClassifier(n_estimators=100, random_state=50, verbose=1, n_jobs=-1)
random_forest_domain.fit(domain_features, train_labels)

feature_importances_values_domain = random_forest_domain.feature_importances_
feature_importances_domain = pd.DataFrame({'feature': domain_features_names, 'importance': feature_importances_values_domain})

predictions = random_forest_domain.predict_proba(domain_features_test)[:, 1]
submit = app_test[['SK_ID_CURR']]
submit['TARGET'] = predictions

submit.to_csv('random_forest_baseline_domain.csv', index=False)
domain knowledge를 사용한 모델의 점수는 0.679이다. 이는 그다지 효과가 있다고 볼 수는 없는 것 같다.
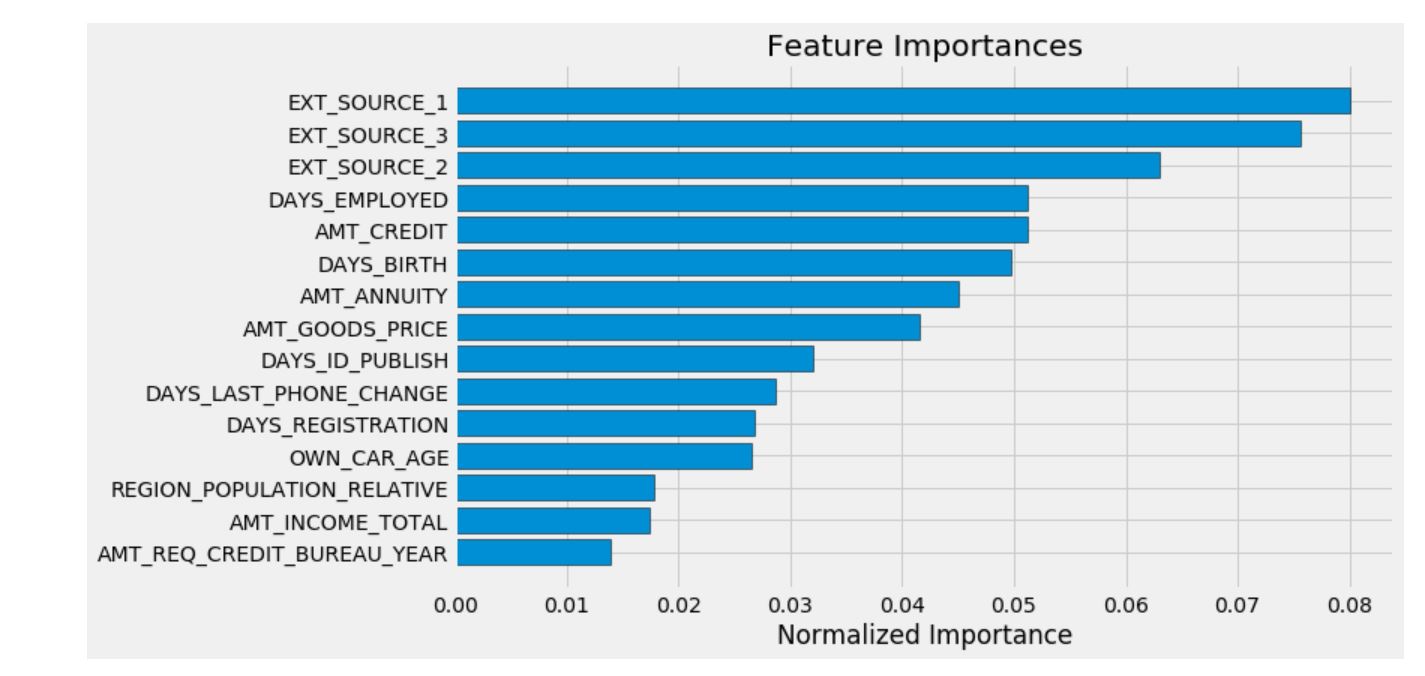
중요한 특성
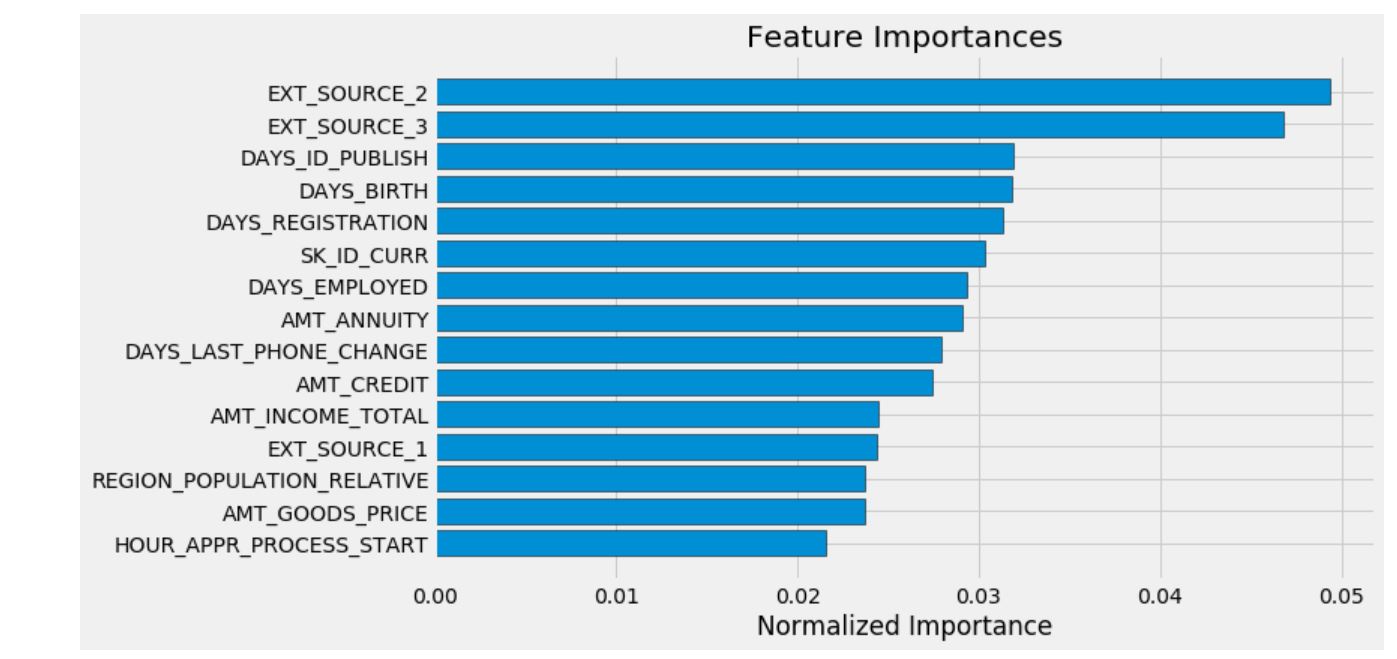
우리는 랜덤포레스트 모델을 사용해서 중요한 특성들을 확인할 수 있었다. EDA 분석으로 상관관계를 분석해보면, 우리에게 가장 중요한 특성은 EXT_SOURCE와 DAYS_BIRTH임을 알 수 있다. 우리는 이 특성들을 미래에 차원축소를 활용한 작업에서 사용해야만 한다.
def plot_feature_importances(df):

    df = df.sort_values('importance', ascending=False).reset_index()
    df['importance_normalized'] = df['importance'] / df['importance'].sum()

    plt.figure(figsize=(10, 6))
    ax = plt.subplot()

    ax.barh(list(reversed(list(df.index[:15]))),
            df['importance_normalized'].head(15),
            align='center', edgecolor='k')
    ax.set_yticks(list(reversed(list(df.index[:15]))))
    ax.set_yticklabels(df['feature'].head(15))

    plt.xlabel('Normalized Importance')
    plt.title('Feature Importances')
    plt.show()

    return df
기본 특성들의 중요도 확인
feature_importances_sorted = plot_feature_importances(feature_importances)
예상했던 것과 같이, 가장 중요한 특성은 EXT_SOURCE와 DAYS_BIRTH이다. 우리는 모델에게 중요한 몇 가지 특성만 존재한다는 것을 알 수 있는데, 이는 우리가 모델의 성능을 저하시킬 수 있는 많은 특성들이 있다는 것을 시사한다.
특성의 중요성은 모델을 해석하거나 차원축소를 수행하는 가장 정교한 방법은 아니지만, 모델이 예측할 때 어떤 요소를 고려하는지를 이해할 수 있는 방법이다.
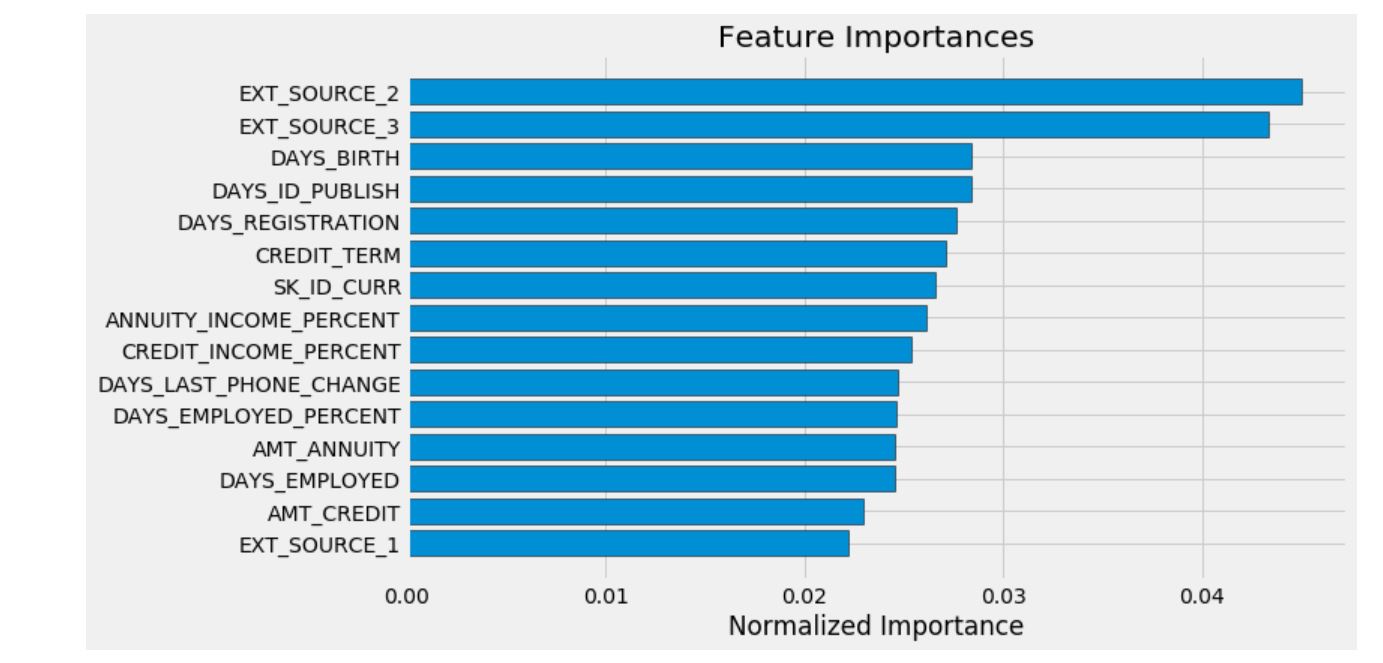
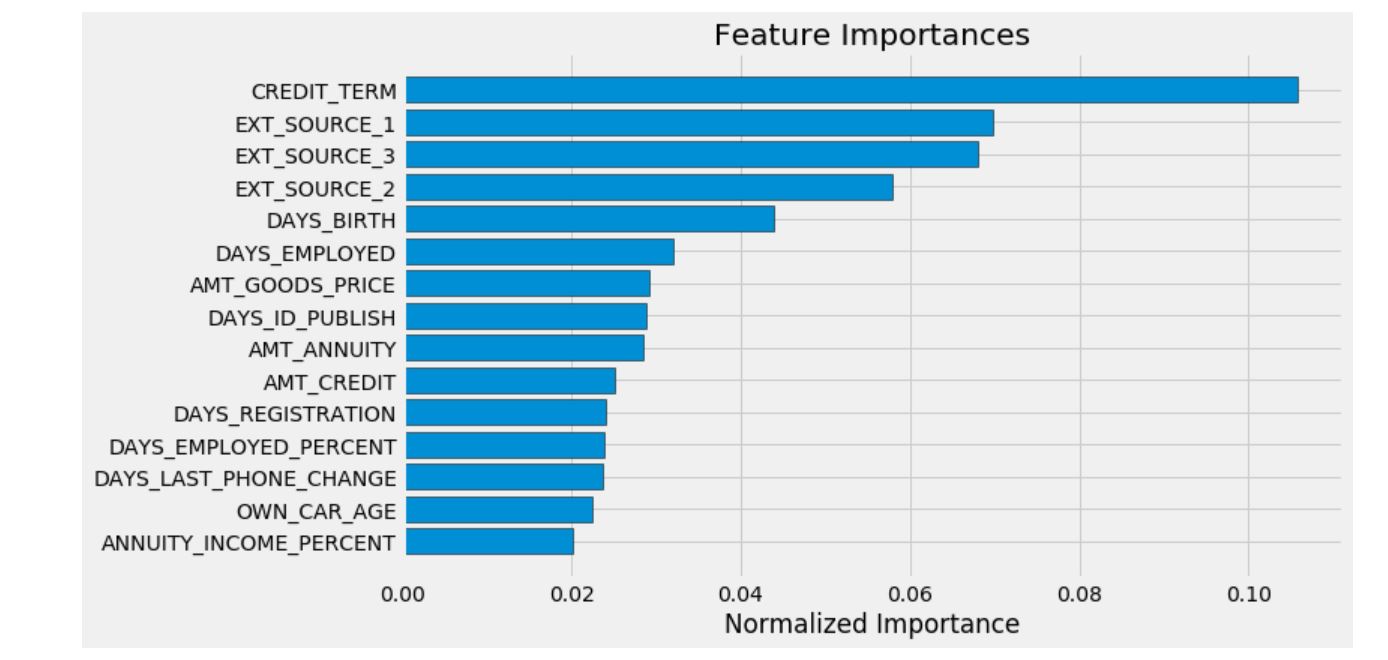
feature_importances_domain_sorted = plot_feature_importances(feature_importances_domain)
위의 그래프를 통해 우리가 직접 만든 특성들이 상위 15개의 중요도 안에 들어가는 것을 확인할 수 있다.
Light Gradient Boosting Machine
LightGBM 모델은 계속해서 각광받고 있는 모델이다. 이 모델을 사용해서 위에서부터 실행했던 전처리 기법과 각각의 특성들에 대한 모델을 만들어 보자.
from sklearn.model_selection import KFold
from sklearn.metrics import roc_auc_score
import lightgbm as lgb
import gc

def model(features, test_features, encoding='ohe', n_folds=5):

    # Extract the ids
    train_ids = features['SK_ID_CURR']
    test_ids = test_features['SK_ID_CURR']

    # Extract the labels for training
    labels = features['TARGET']

    # Remove the ids and target
    features = features.drop(columns = ['SK_ID_CURR', 'TARGET'])
    test_features = test_features.drop(columns = ['SK_ID_CURR'])

    # One Hot Encoding
    if encoding == 'ohe':
        features = pd.get_dummies(features)
        test_features = pd.get_dummies(test_features)

        # Align the dataframes by the columns
        features, test_features = features.align(test_features, join = 'inner', axis = 1)

        # No categorical indices to record
        cat_indices = 'auto'

    # Integer label encoding
    elif encoding == 'le':

        # Create a label encoder
        label_encoder = LabelEncoder()

        # List for storing categorical indices
        cat_indices = []

        # Iterate through each column
        for i, col in enumerate(features):
            if features[col].dtype == 'object':
                # Map the categorical features to integers
                features[col] = label_encoder.fit_transform(np.array(features[col].astype(str)).reshape((-1,)))
                test_features[col] = label_encoder.transform(np.array(test_features[col].astype(str)).reshape((-1,)))

                # Record the categorical indices
                cat_indices.append(i)

    # Catch error if label encoding scheme is not valid
    else:
        raise ValueError("Encoding must be either 'ohe' or 'le'")

    print('Training Data Shape: ', features.shape)
    print('Testing Data Shape: ', test_features.shape)

    # Extract feature names
    feature_names = list(features.columns)

    # Convert to np arrays
    features = np.array(features)
    test_features = np.array(test_features)

    # Create the kfold object
    k_fold = KFold(n_splits = n_folds, shuffle = True, random_state = 50)

    # Empty array for feature importances
    feature_importance_values = np.zeros(len(feature_names))

    # Empty array for test predictions
    test_predictions = np.zeros(test_features.shape[0])

    # Empty array for out of fold validation predictions
    out_of_fold = np.zeros(features.shape[0])

    # Lists for recording validation and training scores
    valid_scores = []
    train_scores = []

    # Iterate through each fold
    for train_indices, valid_indices in k_fold.split(features):

        # Training data for the fold
        train_features, train_labels = features[train_indices], labels[train_indices]
        # Validation data for the fold
        valid_features, valid_labels = features[valid_indices], labels[valid_indices]

        # Create the model
        model = lgb.LGBMClassifier(n_estimators=10000, objective = 'binary',
                                   class_weight = 'balanced', learning_rate = 0.05,
                                   reg_alpha = 0.1, reg_lambda = 0.1,
                                   subsample = 0.8, n_jobs = -1, random_state = 50)

        # Train the model
        model.fit(train_features, train_labels, eval_metric = 'auc',
                  eval_set = [(valid_features, valid_labels), (train_features, train_labels)],
                  eval_names = ['valid', 'train'], categorical_feature = cat_indices,
                  early_stopping_rounds = 100, verbose = 200)

        # Record the best iteration
        best_iteration = model.best_iteration_

        # Record the feature importances
        feature_importance_values += model.feature_importances_ / k_fold.n_splits

        # Make predictions
        test_predictions += model.predict_proba(test_features, num_iteration = best_iteration)[:, 1] / k_fold.n_splits

        # Record the out of fold predictions
        out_of_fold[valid_indices] = model.predict_proba(valid_features, num_iteration = best_iteration)[:, 1]

        # Record the best score
        valid_score = model.best_score_['valid']['auc']
        train_score = model.best_score_['train']['auc']

        valid_scores.append(valid_score)
        train_scores.append(train_score)

        # Clean up memory
        gc.enable()
        del model, train_features, valid_features
        gc.collect()

    # Make the submission dataframe
    submission = pd.DataFrame({'SK_ID_CURR': test_ids, 'TARGET': test_predictions})

    # Make the feature importance dataframe
    feature_importances = pd.DataFrame({'feature': feature_names, 'importance': feature_importance_values})

    # Overall validation score
    valid_auc = roc_auc_score(labels, out_of_fold)

    # Add the overall scores to the metrics
    valid_scores.append(valid_auc)
    train_scores.append(np.mean(train_scores))

    # Needed for creating dataframe of validation scores
    fold_names = list(range(n_folds))
    fold_names.append('overall')

    # Dataframe of validation scores
    metrics = pd.DataFrame({'fold': fold_names,
                            'train': train_scores,
                            'valid': valid_scores})

    return submission, feature_importances, metrics
submission, feature_importances, metrics = model(app_train, app_test)

print('Baseline metrics')
print(metrics)
feature_importances_sorted = plot_feature_importances(feature_importances)
submission.to_csv('baseline_lgb.csv', index=False)
기본 특성들을 가지고 만든 LightGBM 모델의 성능은 0.735이다.
app_train_domain['TARGET'] = train_labels

submission_domain, feature_importances_domain, metrics_domain = model(app_train_domain, app_test_domain)

print('Baseline with domain knowledge features metrics')
print(metrics_domain)
feature_importances_sorted = plot_feature_importances(feature_importances_domain)
submission_domain.to_csv('baseline_lgb_domain_features.csv', index=False)
domain knowledge를 추가한 특성들을 가지고 만든 LightGBM 모델의 성능은 0.754이다. 이는 이전의 만들었던 모델 중 가장 개선된 모델이다.


